What Claude gets from the connection
One connection, eight read-only tools, and nothing Claude has to infer from a column name:
- The model. Every table and column, every relationship as a sentence the business signed off, and for each relationship whether a row must have a match and whether the join can multiply rows. That is what decides an INNER from a LEFT JOIN and keeps a sum from double counting.
- Each table's dossier. Columns with their types, the key, sample values, and every relationship with the join it requires.
- Verified SQL. Claude writes its own SQL and runs it through GramSpec, where it is checked against the model before it reaches your database, read-only, with the same guards Reason uses inside GramSpec.
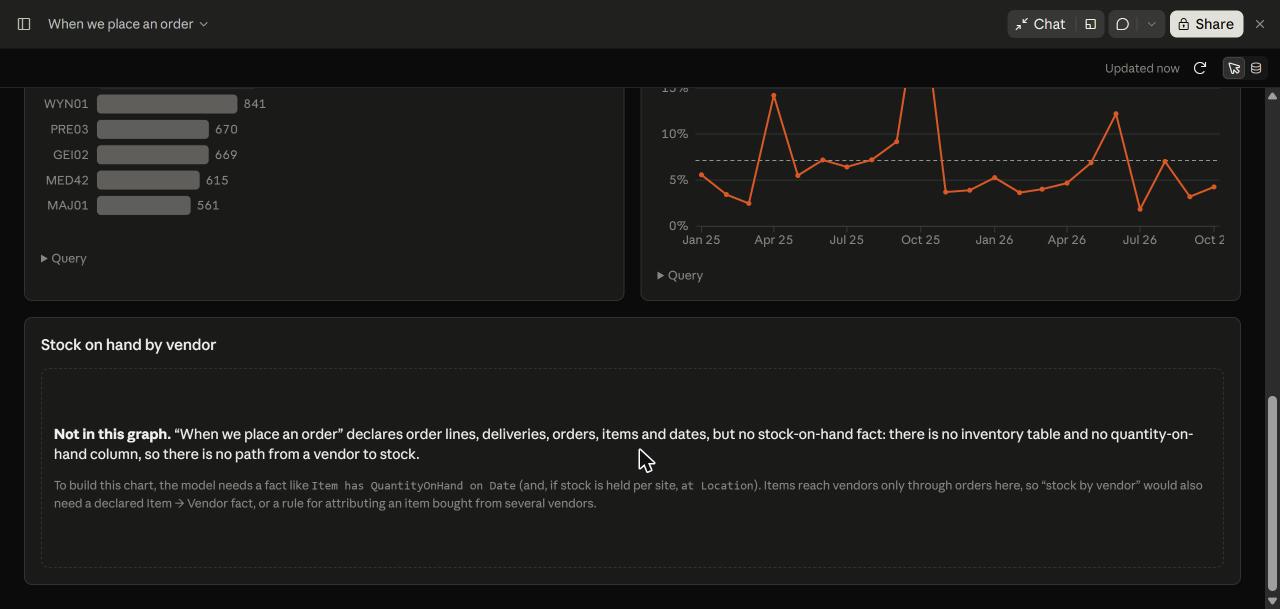
- What is missing, named. Ask for a number the model has no path to and the answer is what the model would need, never a plausible figure.
Claude Dashboards, step by step
- In claude.ai open Customize → Connectors, press
Add, then Add custom connector. Name it
GramSpecand enterhttps://gramspec.com/mcp. Claude reads the sign-in method and its own identity from GramSpec on its own; press Add. - Press Connect. Sign in to GramSpec if you are not already, read what the connection may do as you, and press Approve.
- On the connector's page, under Tool permissions, set Read-only tools to Always allow. A dashboard cannot use a tool that asks before each call, and every GramSpec tool is read-only.
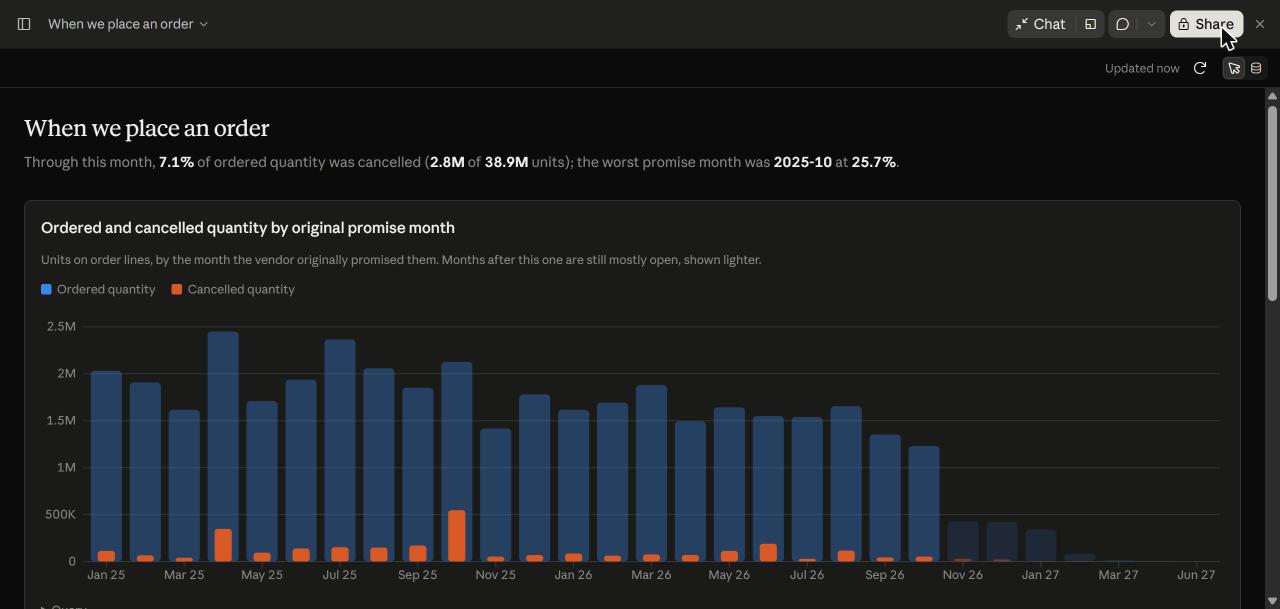
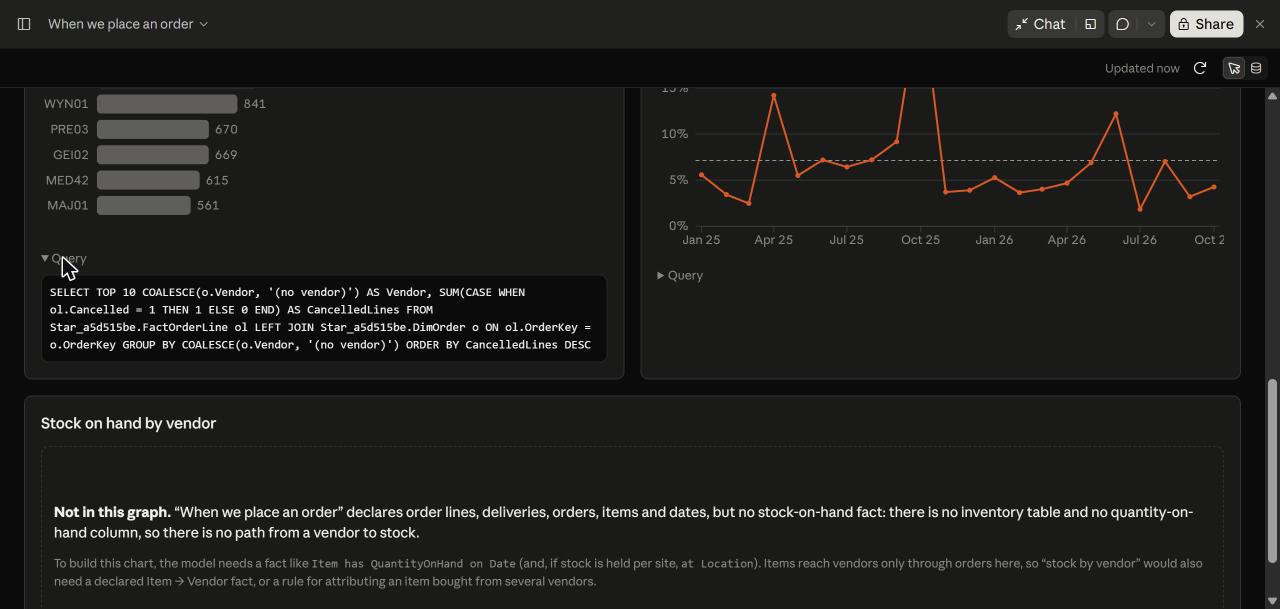
- Open Artifacts → Dashboard and say what you want to see. Name the connector and the graph in the request, for example "Use the GramSpec connector. The graph is When we place an order. Show ordered and cancelled quantity by promise month and the ten vendors with the most cancelled lines." Each chart shows the query that made it.
Sharing a dashboard
A shared dashboard runs its queries as each viewer, with that viewer's own GramSpec sign-in. The connector serves a person their own graphs, so a colleague can open the dashboard only when the graph is theirs as well. A dashboard that uses a connector cannot be shared by a public link; viewers need a Claude account in your organization.
Claude Code
One command, then sign in:
claude mcp add --transport http gramspec https://gramspec.com/mcp
Run /mcp inside Claude Code to sign in with your GramSpec account.
A key from your profile works too, as a header:
claude mcp add --transport http gramspec https://gramspec.com/mcp \
    --header "X-Api-Key: gramspec_your_api_key_here"
Then ask. "Who are our top customers and what do they buy?" lists the graphs, loads the one you name, writes the SQL, checks it against the model and runs it. A page Claude Code publishes can read the connector at view time, so a live dashboard built in Claude Code works the same way as one built in claude.ai.
Claude Desktop and the mobile app
The same custom connector, added once under Connectors, serves claude.ai, Claude Desktop and the mobile app. Cursor and any other tool that speaks MCP connect with the URL above; the API reference has the settings for each.
The eight tools
| Tool | What Claude gets |
|---|---|
list_projects | Your graphs, with whether each can be queried through the connection. |
graph_overview | A compact index of every table, column and relationship: the cheap first look. |
get_graph | The whole model as the canonical GRAM document. |
describe_entity | One table's dossier: columns, key, sample values, every relationship and the join it requires. |
search_graph | Find a table, a column or a sentence inside a large model. |
generate_sql | A question in plain English, answered as SQL verified against the model. This one spends your GramSpec AI allowance. |
validate_sql | Check any SQL against the model without running it. When the model has no path, the verdict names what is missing. |
run_query | Run one read-only SELECT on the graph's connected database and get the rows. Free of AI allowance. |
Every tool declares itself read-only, so Claude can run it without asking before each call once you have allowed it. The connection reaches only your own graphs and the databases they are connected to.
The plan it needs
The connector is part of the Enterprise plan, the same plan that issues API keys. See Pricing, or send us a message. On the Claude side, Dashboards is in beta on paid plans; on Claude Enterprise an owner turns on two switches under Organization settings, Dashboards under Artifacts and "Enable artifact connectors" under Capabilities.
More
The complete surface, the resource and prompt the connection also serves, and the recipe for a branded analyst of your own are in the API reference. What a model declares and why it is enough for a machine to join correctly is the specification.